Ultrasound acquisition
The Phonology Lab has a SonixTablet system from Ultrasonix for performing ultrasound studies. Consult with Susan Lin for permission to use this system.
Data acquisition workflow
The standard way to acquire ultrasound data is to run an Opensesame experiment on a data acquisition computer that controls the SonixTablet and saves timestamped data and metadata for each acquisition.
Prepare the experiment
The first step is to prepare your experiment. You will need to create an Opensesame script with a series of speaking prompts and data acquisition commands. In simple situations you can simply edit a few variables in our sample script and be ready to go. Do not start your OpenSesame experiment until after turning the Ultrasonix system on or you risk the system not starting.
Run the experiment
These are the steps you take when you are ready to run your experiment:
Check the audio card
Normally the Steinberg UR22 USB audio interface is used to collect microphone and synchronization signals.
- If the 'USB' light on the front of the UR22 is not solid white, check the USB cable connections at both ends.
- Ensure the UR22 is the default Windows recording device. See the Windows Control Panel > Sound > Recording settings. The 'Steinberg UR22' device (possibly labelled 'Line' rather than 'Microphone') should be marked as the default device and have a green check mark. If it is not the default device, select it and click the 'Set Default' button to change its status.
- Set the +48V switch on the back of the UR22 to 'On'. The '+48V' light on the UR22 should glow solid red. This setting provides phantom power for condenser-style microphones, which we almost always use in the Lab.
- Plug the microphone into XLR input 1.
- Plug the synchronization signal cable into XLR input 2.
- Check to make sure the 'Mix' knob is turned all the way to 'DAW'.
- Set the gain levels for the microphone and synchronization signals with the 'Input 1' and 'Input 2' knobs.
Start the ultrasound system
- Unplug one of the external monitors' video cables from the splitter that is plugged into the Ultrasonix's external video port.
- Turn on the ultrasound system's power supply, found on the floor beneath the system.
- Turn on the ultrasound system with the pushbutton on the left side of the machine.
- Once Windows has started you can plug the second external monitor's video cable back into the splitter.
- Start the Sonix RP software.
- If the software is in fullscreen (clinical) mode, switch to windowed research mode as illustrated in the screenshot.
Start the data acquisition system
- Turn on the data acquisition computer next to the ultrasound system and use the LingGuest account.
- Check your hardware connections and settings:
- The Steinberg UR22 USB audio device should be connected to the data acquisition computer.
- The subject microphone should be connected to 'Mic/Line 1' of the audio device. Use the patch panel if your subject will be in the soundbooth.
- Make sure the '+48V' switch on the back of the audio device is set to 'On' if you are using a condenser mic (usually recommended).
- Make a test audio recording of your subject and adjust the audio device's 'Input 1 Gain' setting as needed.
- The synchronization signal cable should be connected to the BNC connector labelled '25' on the SonixTablet, and the other end should be connected to 'Mic/Line 2' of the audio device.
- The audio device's 'Input 2 Hi-Z' button should be selected (pressed in).
- The audio device's 'Input 2 Gain' setting should be at the dial's midpoint.
- Open and run your Opensesame experiment.
Postprocessing
Each acquisition resides in its own timestamped directory. If you follow the normal Opensesame script conventions these directories are created in per-subject subdirectories of your base data directory. Normal output includes a .bpr file containing ultrasound image data, a .wav containing speech data and the ultrasound synchronization signal in separate channels, and a .idx.txt file containing the frame indexes of each frame of data in the .bpr file.
Getting the code
Some of the examples in this section make use of ultratils and audiolabel Python packages from within the Berkeley Phonetics Machine environment. Other examples are shown in the Windows environment as it exists on the Phonology Lab's data acquisition machine. To keep up-to-date with the code in the BPM, open a Terminal window in the virtual machine and give these commands:
 sudo bpm-update bpm-update
 sudo bpm-update ultratils
 sudo bpm-update audiolabel
Note that the audiolabel package distributed in the current BPM image (2015-spring) is not recent enough for working with ultrasound data, and it needs to be updated. ultratils is not in the current BPM image at all.
Synchronizing audio and ultrasound images
The first task in postprocessing is to find the synchronization pulses in the .wav file and relate them to the frame indexes in the .idx.txt file. You can do this with the psync script, which you can call on the data acquisition workstation like this:
 python C:\Anaconda\Scripts\psync --seek <datadir>   # Windows environment
 psync --seek <datadir>                                                # BPM environment
Where <datadir> is your data acquisition directory (or a per-subject subdirectory if you prefer). When invoked with --seek, psync finds all acquisitions that need postprocessing and creates corresponding .sync.txt and .sync.TextGrid files. These files contain time-aligned pulse indexes and frame indexes in columnar and Praat textgrid formats, respectively. Here 'pulse index' refers to the synchronization pulse that is sent for every frame acquired by the SonixTablet; 'frame index' refers to the frame of image data actually received by the data acquisition workstation. Ideally these indexes would always be the same, but at high frame rates the SonixTablet cannot send data fast enough, and some frames are never received by the data acquisition machine. These missing frames are not present in the .bpr file and have 'NA' in the frame index (encoded on the 'raw_data_idx' tier) of the psync output files. For frames that are present in the .bpr you use the synchronization output files to find their corresponding times in the audio file.
Separating audio channels
If you wish you can also separate the audio channels of the .wav file into .ch1.wav and .ch2.wav with the sepchan script:
 python C:\Anaconda\Scripts\sepchan --seek <datadir>  # Windows environment
 sepchan --seek <datadir>                                                # BPM environment
This step takes a little longer than psync and is optional.
Extracting image data
You can extract image data with Python utilities. In this example we will extract an image at a particular point in time. First, load some packages:
 from ultratils.pysonix.bprreader import BprReader
 import audiolabel
 import numpy as np
BprReader is used to read frames from a .bpr file, and audiolabel is used to read from a .sync.TextGrid synchronization textgrid that is the output from psync.
Open a .bpr and a .sync.TextGrid file for reading with:
 bpr = '/path/to/somefile.bpr'
 tg = '/path/to/somefile.sync.TextGrid'
 rdr = BprReader(bpr)
 lm = audiolabel.LabelManager(from_file=tg, from_type='praat')
For convenience we create a reference to the 'raw_data_idx' textgrid label tier. This tier provides the proper time alignments for image frames as they occur in the .bpr file.
bprtier = lm.tier('raw_data_idx')
Next we attempt to extract the index label for a particular point in time. We enclose this part in a try block to handle missing frames.
 timept = 0.485
 data = None
 try:
     bpridx = int(bprtier.label_at(timept).text)   # ValueError if label == 'NA'
     data = rdr.get_frame(int(bpridx))
 except ValueError:
     print "No bpr data for time {:1.4f}.".format(timept)
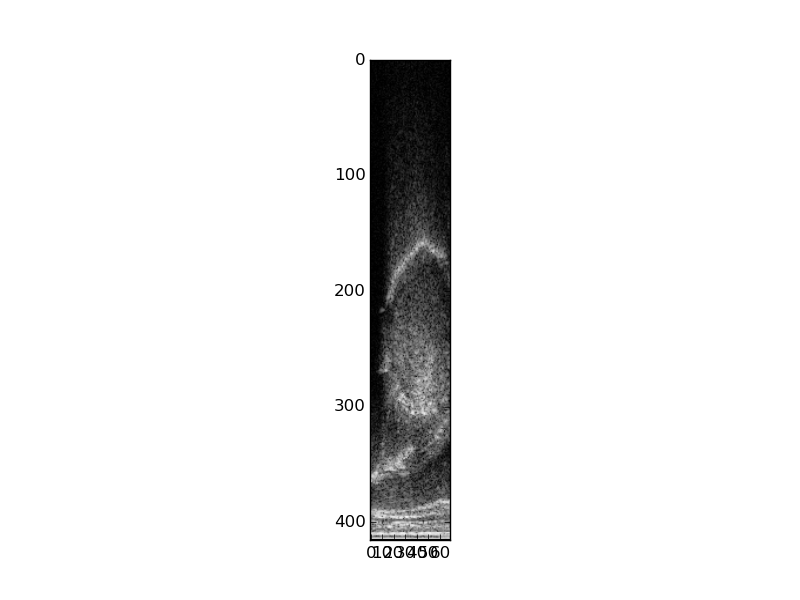
Recall that some frames might be missed during acquisition and are not present in the .bpr file. These time intervals are labelled 'NA' in the 'raw_data_idx' tier, and attempting to convert this label to int results in a ValueError. What this means is that data will be None for missing image frames. If the label of our timepoint was not 'NA', then image data will be available in the form of a numpy ndarray in data. This is a rectangular array containing a single vector for each scanline.
Transforming image data
Raw .bpr data is in rectangular format. This can be useful for analysis, but is not the norm for display purposes since it does not account for the curvature of the transducer. You can use the ultratils Converter and Probe objects to transform into the expected display. To do this, first load the libraries:
 from ultratils.pysonix.scanconvert import Converter
 from ultratils.pysonix.probe import Probe
Instantiate a Probe object and use it along with the header information from the .bpr file to create a Converter object:
 probe = Probe(19)    # Prosonic C9-5/10
 converter = Converter(rdr.header, probe)
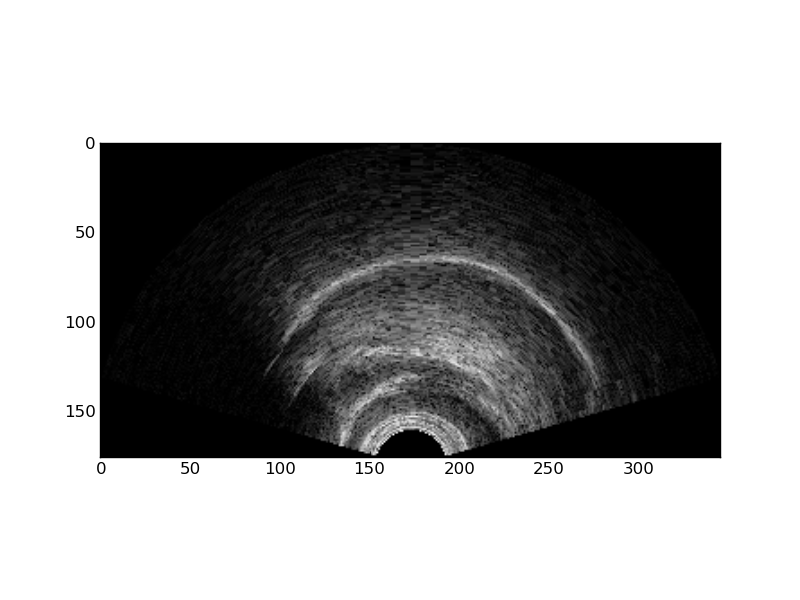
We use the probe id number 19 to instantiate the Probe object since it corresponds to the Prosonic C9-5/10 in use in the Phonology Lab. (Probe id numbers are defined by Ultrasonix in probes.xml in their SDK, and a copy of this file is in the ultratils repository.) The Converter object calculates how to transform input image data, as defined in the .bpr header, into an output image that takes into account the transducer geometry. Use as_bmp() to perform this transformation:
bmp = converter.as_bmp(data)
Once a Converter object is instantiated it can be reused for as many images as desired, as long as the input image data is of the same shape and was acquired using the same probe geometry. All the frames in a .bpr file, for example, satisfy these conditions, and a single Converter instance can be used to transform any frame image from the file.
These images illustrate the transformation of the rectangular .bpr data into a display image.
If the resulting images are not in the desired orientation you can use numpy functions to flip the data matrix:
 data = np.fliplr(data)        # Flip left-right.
 data = np.flipud(data)        # Flip up-down.
 bmp = converter.as_bmp(data)  # Image will be flipped left-right and up-down.
In development
Additional postprocessing utilities are under development. Most of these are in the ultratils github repository.
Troubleshooting
See the Ultrasonix troubleshooting page page to correct known issues with the Ultrasonix system.

